Weather and Climate Summary and Forecast
May 2024 Report
Gregory V. Jones, Ph.D.
May 3, 2024
Summary:
- A mild April across the west with most regions seeing slightly warmer than average* temperatures. Exceptions were a cooler than average month in north-central Oregon, southern California, and the southwest.
- Overall, a dry April for much of the western US, except for the central coast of California and Arizona which experienced a wetter than average month.
- End of April snow water equivalents (SWE) are running higher than normal for much of the central to southern basins across the west, while the northern basins in the PNW and Rockies ended the winter lower than average.
- A cool start to May for much of the west will likely slowly give way to a warmer second half of the month, ending with something close to normal for most areas. North, wet over the next few days; South dry.
- The overall May precipitation forecast is not very telling, with the vast majority of the west having equal chances of seeing above, normal, and below average amounts.
- The 90-day seasonal forecast is tilting the odds to a warmer than average first half of summer for the western US, except the southern portions of California and the southwest which is forecast to be near normal. As mentioned last month, I am still holding to what I have been seeing for months now, a little cooler than what is expected for May and early June, then ramping up to warmer than average from the middle of June through August. The forecast also continues to point to near average precipitation for most, to drier than average, especially in the PNW.
- El Niño persists for now but continues to wane, with a La Niña watch still in place for the fall. As such a warmer summer for much of the US is likely, along with a more active hurricane season in the Atlantic and Gulf.
*Note that all references to normal or averages in this report are to the 1991-2020 climate normal for each weather/climate parameter unless stated otherwise. See this website for more information on climate normals.
For a PDF of this report, click here.
Past Month and Year-to-Date:
April 2024 was relatively mild over much of the western US with temperatures largely between +/- 2 degrees from normal (Figure 1). A cooler than average month was experienced over southern California and the southwest with the spatial pattern similar to the cloud cover and precipitation seen in the region. Cooler than average temperatures were also seen over a portion of central Oregon. The regions seeing the warmest departures from normal were mostly in the Rockies and into the northern Plains. Similar to March, April saw much warmer than average conditions from the Rockies and Plains eastward with temperatures 1-6 degrees above average (not shown).
Precipitation amounts in Aprill 2024 across the western US were mostly near normal to drier than average with many locations running between 50-90% of average (Figure 1). The exceptions were in the central coast of California, much of Arizona, and areas of the northern Great Basin where 110-200% of normal occurred in April. Across the rest of the country, drier than average conditions were experienced in the southwest, mid-Atlantic, Florida, and northern New England, with the heartland seeing an active storm track with plenty of precipitation but also severe weather with a large number of damaging tornadoes (not shown).
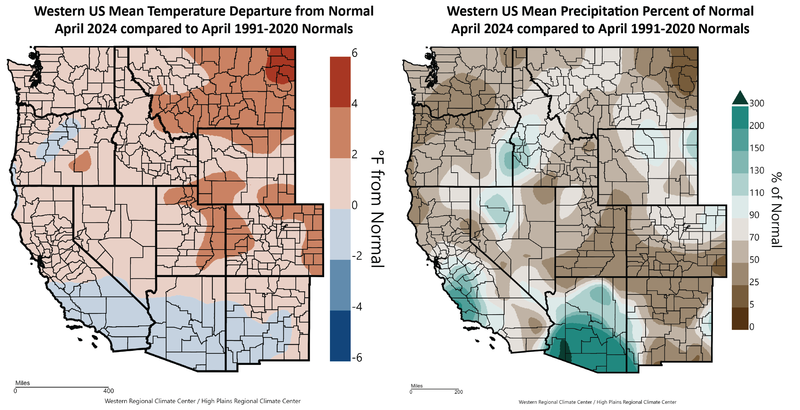
Figure 1 – Western US April 2024 temperature departure from normal (left) and percent of normal precipitation (right; images from WestWide Drought Tracker, Western Region Climate Center; University of Idaho).
Year-to-date conditions over the western US have largely been warmer and wetter than normal (Figure 2). Temperatures have been warmer than average over much of the west, with an area from southern Oregon, across into Idaho, the Great Basin, and into the Rockies experiencing 1-3 degrees higher than normal. A cooler than average first four months of the year has been seen in north-central Oregon, central Montana, and across southern California and much of Arizona where temperatures have been 1-3 degrees below normal. The majority of the continental US has also been warmer than average year-to-date (not shown). The warmest conditions have been seen across the northern Plains, the Great Lakes, the upper Midwest, and New England where temperatures have been 2-8 degrees above average. The Gulf Coast and southeastern US have been running slightly above average for the first four months (0.5-2.0 degrees).
Precipitation amounts year-to-date in the western US have largely been 90-200% of normal (Figure 2). The areas experiencing the wettest conditions are much of coastal California and especially the south coast, along with much of Arizona. The driest regions have been across much of Washington, the northern Rockies of Montana and Idaho, which have experienced 50-90% of normal precipitation and currently have 80% or less of snow water equivalents (SWE) in mountain basins (Figure 2). Basins across California, Nevada, the Rockies, and the southwest are holding above average SWE at the end of April. For the rest of the country, the year-to-date has been largely wetter than average although areas across west Texas, New Mexico, and the southern Plains remain dry (not shown), adding to drought concerns in the region (see Drought section below).
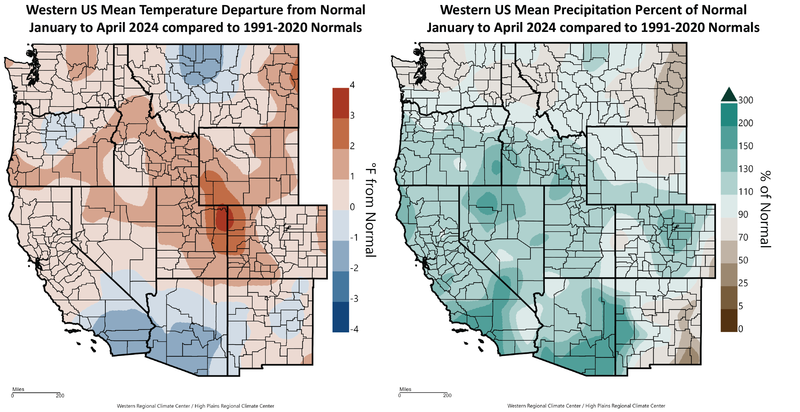
Figure 2 – Western US year-to-date (January 1 through April 30, 2024) temperature departure from normal (left) and percent of normal precipitation (right; images from WestWide Drought Tracker, Western Region Climate Center; University of Idaho).
Heat Accumulation: For the first look at growing degree-days (GDDs) over the western US for 2024, Figure 3 shows a very mixed bag with the vast majority of the west seeing slightly below average accumulation during March and April. The central coast and southern California across into the southwest have seen much lower than average accumulation for the early part of the season. Scattered areas in California and across the PNW have accumulated slightly more than average, but the numbers overall are generally within +/- 10% with no regions seeing substantial differences from the 1991-2020 normals (Figure 3). Converting the mapped data in Figure 3 to days ahead or days behind normal finds the west mostly 2-8 days ahead in some of the western valleys to 5-20 days behind normal accumulation amounts in the inland PNW and the central coast to southern California regions (not shown).
Heat accumulation (GDD) amounts for four locations that I have tracked for many years in wine regions in Oregon are mostly above both the 1981-2010 and 1991-2020 climate normals for the month of April (Figure 4). The exception is that eastern Oregon is slightly below the 1991-2020 climate normal which can also be seen in Figure 3.
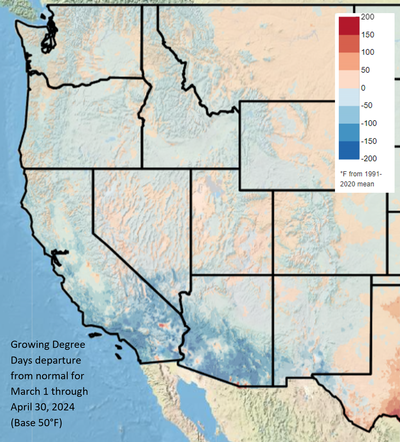
Figure 3 – Western US March through April 2024 growing degree-days (image from Climate Impacts Research Consortium, University of Idaho).
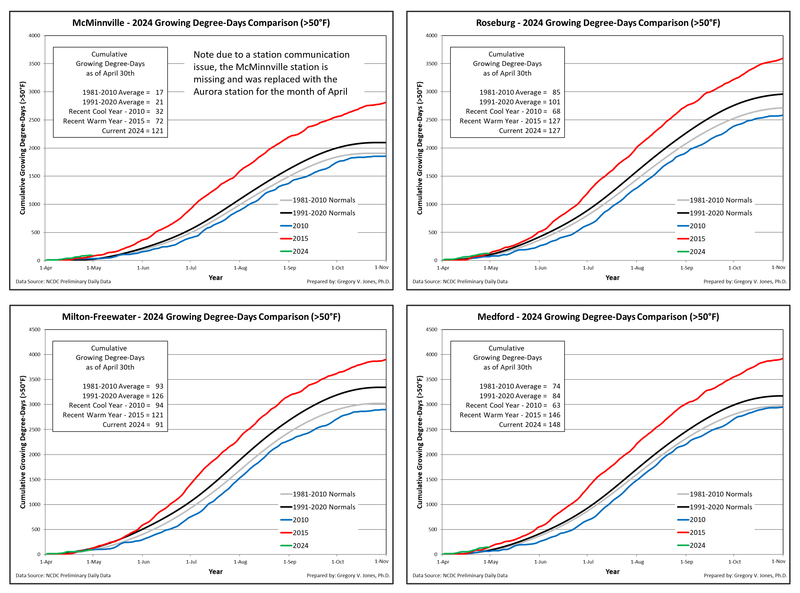
Figure 4 – Cumulative growing degree-days (base 50°F, no upper cut-off) for McMinnville, Roseburg, Milton-Freewater, and Medford, Oregon. Comparisons between the current year (2023) and a recent cool year (2010), a recent warm year (2015), and both the 1981-2010 and 1991-2020 climate normals are shown (NCDC preliminary daily data).
Drought Watch – Changes to the overall drought situation in the US largely occurred across the middle of the country where cold and warm air clash this time of year bringing severe weather but lots of rain. The rest of the country did not see much change in drought conditions over the last month (Figure 5). The events in the middle of the country helped lower the overall drought footprint for the continental US to roughly 37% in drought with the most extreme drought categories remaining close to 6%. For the western US, the current drought area dropped slightly to just over 46% with the most extreme categories decreasing in April to roughly 6%. A relatively dry April in the PNW increased drought concerns with Washington seeing an increase to 61% of the state in drought, but all at the lower categories with no areas in the most extreme categories. Oregon also saw drier than normal conditions in April (Figure 1), with the state’s drought footprint increasing to just over 41% but with no areas in the extreme drought categories (severe, extreme, and exceptional). For Idaho, the northern portion of the state and neighboring Montana remain in moderate to extreme drought (just over 9% in Idaho), however the rest of the state has dropped to just under 30% in some category of drought. California experienced a mixed pattern of a wetter to drier than normal April (Figure 1), but not enough in either direction to change the overall near complete absence of drought with only 3% of the state in some level of drought, and no areas with the more extreme drought categories (Figure 5).
The seasonal drought outlook heading into summer is similar to the past couple of months (Figure 5; right panel), with improvements in some areas and hints at worsening conditions in others. Spring into summer will likely continue to bring enough precipitation to the middle of the country which is now forecast for drought improvement or complete removal. Texas, New Mexico, and the southern Rockies are forecast to see the overall drought footprint increase into summer, which would be expected given the shift to La Niña that is anticipated (see forecast section below). Western portions of the PNW are expected to remain drought free, however the inland areas of Washington across northern Idaho and into the Rockies are forecast to see drought conditions persist and develop further over the region.
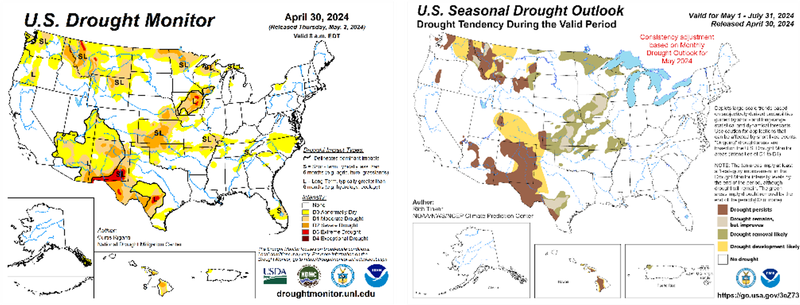
Figure 5 – Current US Drought Monitor and seasonal drought outlook.
ENSO Watch – As of late April, El Niño conditions still persist in the central-eastern tropical Pacific, although key variables in the atmosphere and ocean are also showing signs of a shift to more neutral conditions. Sea surface temperature (SST) anomalies across the Tropical Pacific have turned cooler, indicating that the current event is waning (Figure 6). The area of below average SSTs showing up west of Ecuador has grown in extent, creating a pattern that looks similar to what would be expected from the forecasted La Niña (Figure 6). The Climate Prediction Center (CPC) and numerous other agencies continue to forecast that the current El Niño will weaken from now through June 2024 (85% chance) becoming ENSO-neutral soon thereafter. Agencies are also pointing to increasing odds of La Niña developing by August 2024 (60% chance). These anticipated changes in the tropical Pacific are driving much of the 2024 forecast for the globe and the US. Typically, El Niño conditions add to warmer temperatures globally and will likely do so this year as well. However, global temperatures are now projected to be not quite as warm in the second half of 2024 largely due to the expected shift to La Niña. For the US, the shift to La Niña is correlated with the development of a semi-permanent ridge over the middle of North America which should bring a hot and dry summer. This correlation is even stronger when La Niña comes on the heels of a strong El Niño event, like we have just experienced.
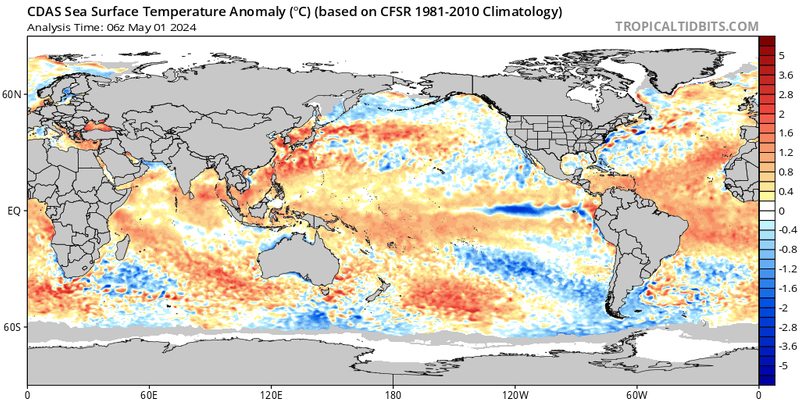
Figure 6 – Global sea surface temperatures (°C) for the period ending May 1, 2024 (image from Tropicaltibits.com).
North Pacific Watch – SSTs in the North Pacific have not changed as much as those in the Tropical Pacific. Cool SST anomalies continue to cover much of the Gulf of Alaska, offshore of the west coast, and extending from Baja California across to the Hawaiian Islands (Figure 6). Warm SST anomalies continue to occur out over the middle of the North Pacific and along the west coast of the US. The pattern of SSTs has the Pacific Decadal Oscillation (PDO) in a negative phase, although it is much lower than it has been over the last 18-24 months. The cooler SST anomalies, along with a more north-south extended jet stream, have likely supported the cooler spring we have experienced in the west. However, the PDO tends to have less influence on the summertime weather over North America, so one would expect the effect to diminish in the coming months.
Forecast Periods:
Next 5 Days: Unseasonably cool to start the month and lasting through the weekend. Active frontal passages with cold air aloft creating off and on precipitation, especially the further north you go in the western US. Daytime ground heating has the potential to generate vertical cloud development with the possibility of thunderstorms, decent rain, and possibly graupel. Nighttime clearing will bring many places into the 40s and even down close to frost.
6-10 Day (valid May 8-12): The overall circulation pattern looks to maintain a dip in the jet stream over the west allowing cold air to likely dominate. Some warming to milder conditions toward the end of the forecast period. While some precipitation will be in play during this period, the overall forecast is leaning toward much of the west coast seeing below normal rainfall for this time in May. The west to east flip-flop is on again with the colder temperatures in the west giving way to warmer temperatures over most of the eastern US with the greatest probability across the south and up into the mid-Atlantic. Dry to near normal precipitation along the west coast shifts to the likely occurrence of a wetter than average forecast period for much of the eastern 2/3 of the country, except southern Texas and Florida where drier conditions are likely.
8-14 Day (valid May 10-16): Some improvement from cool to milder conditions along the west coast and even to a greater probability of above average temperatures for central California into the PNW. Cooler air is slower to move out of southern California, the southwest, and Rockies with below average temperatures forecast for mid-month. A drier mid-month is likely for northern California into the PNW, while southern California into the Rockies has a greater chance of above average precipitation for this time in May. Heading eastward, the southern states are likely to experience above average temperatures while the Midwest, Great Lakes, and New England are likely to see near normal temperatures. For precipitation, this forecast period has the bulk of the US likely seeing above average amounts, except the northern Plains, portions of the Great Lakes, and south Florida.
30 Day (valid May 1-31): A month ago the western US appeared headed to warm May, the forecast has shifted somewhat with the bulk of the west now being given equal chances of above to below normal temperatures (Figure 7). The exception in the west is in southern California where persistent marine layers pushing inland are more likely to get the area near normal for May temperatures. The precipitation forecast for the western US appears to have much of the same with equal chances of above to below precipitation for much of the region, except portions of the southwest where a drier than normal month is forecast. The eastern US forecast has maintained a likely warmer than average month, especially the Great Lakes region and from Texas across the south. The May precipitation forecast is not very telling across the rest of the country with the mid-South and western Great Lakes having a decent chance for a wet month, while Florida is likely to remain dry for the month of May (Figure 7).
90 Day (valid May-June-July): After what appears to be a mild May for the western US, the three-month forecast into June and July is holding to the majority of the country likely seeing a warmer than average start to summer (Figure 7). The PNW, Texas and New Mexico, and the eastern Great Lakes have the greatest probability for a warmer 90-day period while a portion of the northern Plains and southern California will likely be closer to average. The three month precipitation forecast is not very telling as the timing of the shift from El Niño to La Niña is playing out over the period. Much of the country has a 90-day forecast of equal chances of above to below precipitation, with portions of the PNW and the southwest having the greatest chance for a dry period while the southeast is more likely to see above average precipitation (Figure 7).
Figure 7 – Temperature (left panel) and precipitation (right panel) outlooks for the month of May (top panel) and May, June, and July (bottom panel) (Climate Prediction Center, climate.gov).