Weather and Climate Summary and Forecast
January 2026 Report
Gregory V. Jones, Ph.D.
January 2, 2026
Summary:
- A warmer than average* December across the western US, with the Basin and Rockies seeing the warmest conditions during the month. For 2025, the entire country was warmer than average, likely a top 5 warmest year on record.
- The December precipitation forecast was mostly a bust, especially in the PNW and California, where atmospheric rivers and late-month storms brought most regions significantly above average rainfall with substantial impacts from flooding.
- Drought conditions in the west have improved for all except the Southwest; however, warm conditions for the winter have left snowpacks below normal for most areas, while reservoirs are mostly full. As such, we remain in a ‘snow drought’ across nearly all mountain basins in the western US except for the central to southern Sierra Nevada mountains. There is still time to make up for snow deficits, but the window is shrinking daily.
- Precipitation for much of the west during the first week or so of January, temperatures dropping over the next few days will lower snow levels some.
- Heading into mid-month, milder and drier conditions are likely over most of the west. Overall, the first month of the year will likely end up near average to warmer than average for temperatures and near average to below average for precipitation.
- So far, the winter has not followed what would be expected from La Niña and negative PDO, not sure why, but the seasonal forecasts are still holding to this influence and are tilting the odds to a cooler and wetter second half of winter from northern California into the PNW, and cool to near average and dry into southern California.
*Note that all references to normal or averages in this report are to the 1991-2020 climate normal for each weather/climate parameter unless stated otherwise. See this website for more information on climate normals.
For a PDF of this report, click here.
Past Month and 2025: The very warm first 20 days of December 2025 kept the month warmer than average over the western US (Figure 1). The warmest conditions were seen in the Basin and Rockies, where temperatures were 10-20°F above average for the month. Continued ridging in the west brought prolonged tule fog in the central valley of California keeping temperatures there closer to average, but also created the strong trough in the east, bringing much colder Arctic air and lower than average temperatures (5-15°F below) to the Great Lakes, mid-Atlantic, and New England (not shown). The forecast for a wetter PNW held, but not for a drier California, as low pressure areas dipped far to the south bringing record breaking rain to portions of southern California, while areas not far away were extremely dry (Figure 1). Rainfall amounts across the west were generally 100-250% of average, while some areas of the northern Rockies, northern Plains, and Nevada saw 300% of average December precipitation. At the same time, portions of the west were quite dry with the driest conditions occurring in the southwest (0-70% of average), the Bay Area, southern Oregon, and northeastern Washington, where 50-75% of average December precipitation occurred. Across the country, December 2025 saw wettest conditions across the northern Plains to the Great Lakes, while drier than average conditions occurred from the southwest, into the southern Rockies, across the central Plains and south into Texas, and across most of the south (not shown).
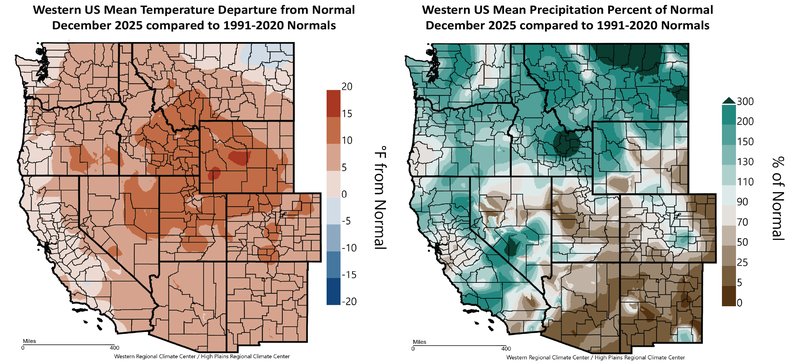
Figure 1 – Western US December 2025 temperature departure from normal (left) and percent of normal precipitation (right; images from WestWide Drought Tracker, Western Region Climate Center; University of Idaho).
Closing out 2025, temperatures ended up above average for the vast majority of the western US (Figure 2). From the Rockies to the west coast, the western US averaged 3 degrees above normal (the 3rd or 4th warmest on record), with minimum temperatures elevated slightly more than maximum temperatures. Coastal zones in California and some isolated mountain regions ended up closer to 0.5-1.5 degrees above average. The rest of the continental US also experienced a warmer than average year (+2.4 degrees), ranking as the fifth warmest year since 1885, with the Four Corners region seeing the greatest departures from average for 2025 (not shown).
Averaged over the western US, precipitation amounts in 2025 were lower than average, ranking as the 23rd driest since 1885. However, there was a significant spatial difference in precipitation amounts in the western US with values ranging from 50-300% of normal (Figure 2). The areas with the wettest conditions in 2025 were across much of California, portions of the southwest, and inland areas of Oregon and Washington, across to Idaho and Montana. The driest regions were across much of the rest of the PNW, Utah, portions of the Four Corners, and the western slope of Colorado, which experienced 50-90% of normal precipitation (Figure 2). The rest of the country ended up close to average for precipitation in 2025, with the PNW being the driest region across the country when compared to average (not shown).
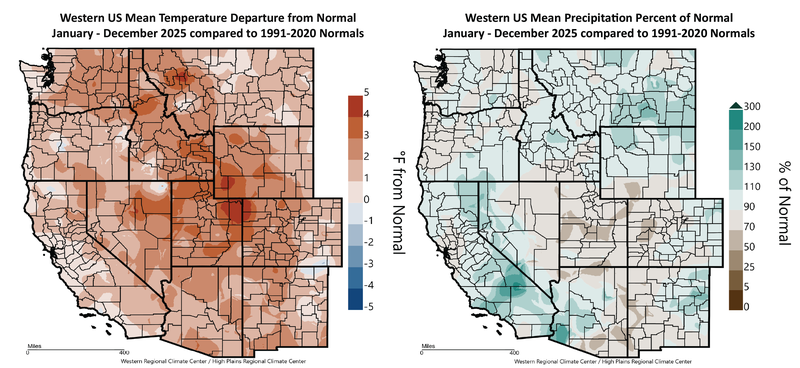
Figure 2 – Western US year to date (January 1 through December 31, 2025) temperature departure from normal (left) and percent of normal precipitation (right; images from WestWide Drought Tracker, Western Region Climate Center; University of Idaho).
Snowpack and Drought Watch – Precipitation amounts over the west in December were enough to lower drought levels for many (Figure 1), while other areas of the country saw drought concerns rise (Figure 3). However, the overall drought pattern in the west is largely the same for the inland PNW, Northern to Central Rockies, and the southwest, remaining moderately to significantly drier than average. For the continental US, the overall drought footprint depicted in Figure 3 increased slightly to 70% (mostly in the east), with the most extreme drought categories remaining low at 14%. A wet December in California and portions of the intermountain west brought the overall footprint down slightly to just over 64% with the most extreme categories dropping the most to 19% of the west in more severe to exceptional drought conditions. December was relatively wet for most of the PNW, lowering Washington’s overall drought area to close to 78%, while the most extreme categories dropped nearly 20%, to 13% today. Oregon was mostly wetter than average in December, except the southwestern portion of the state (Figure 1), dropping the state’s drought footprint from 74% to 60%, with the extreme drought categories (severe, extreme, and exceptional) remaining close to 6% of the state. Montana also saw a decline in its overall drought footprint to just below 52% of the state in some level of drought, with the extreme categories dropping even more to nearly 10% of the state. Not much change was seen in Idaho, which remained at close to 92% of the state now in some level of drought, but it has continued to see the more extreme categories of drought drop to just below 10% now. A wet December across most of California (Figure 1) has nearly removed drought concerns from the state. Overall, the drought footprint dropped from 17% to close to 3%, mostly confined to the northeastern corner of the state (Figure 3, left panel).
While December was relatively wet over the west, the warmer than average temperatures (Figure 1) brought higher snow levels and more rain than snow. The result is snowpack that is substantially below average over most of the West. Snow water equivalent (SWE) in basins across the west is 10-45% of normal from Washington, across Oregon, into the Basin and across the southern Rockies and southwest. The southern to central Sierra Nevada mountains and a few basins in the northern Rockies are the only basins seeing above average SWE in the west. However, the water year to date precipitation amounts are closer to 100% of average to over 200% of average over these same basins, indicating the warmer conditions across the west.
Across most of the western US, the seasonal drought outlook continues to point to the likelihood of improvement in drought or removal altogether in the PNW (Figure 3; right panel). California is forecast to remain drought-free, while the southwest remains one of the driest regions in the country. However, the early season lack of snow in the mountains, with most basins currently having extremely low snowpacks and snow water equivalents, would push all of the west directly back into drought if we don’t make up the deficits by spring. Dry conditions are also expected to continue or develop further across the Plains, most of Texas, Florida, the southeast, and New England.
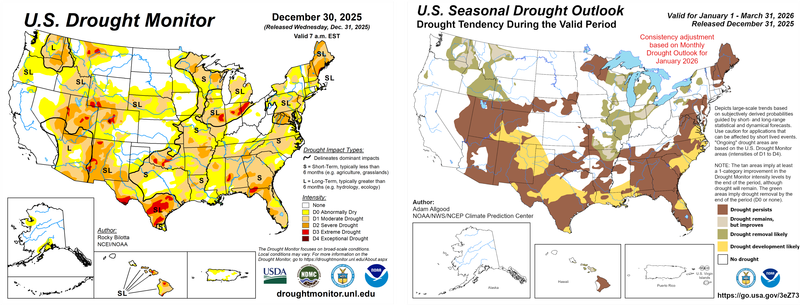
Figure 3 – Current US Drought Monitor and seasonal drought outlook.
ENSO Watch – The Climate Prediction Center has the ENSO alert system in a La Niña advisory. SSTs in the central-eastern equatorial Pacific are mostly below average (Figure 4), indicating that the tropical Pacific is currently in a La Niña state. However, models continue to indicate a likely gradual warming trend over the next few months. The evolution of other key oceanic and atmospheric variables also remains consistent with La Niña conditions. The Climate Prediction Center continues to forecast that this event will likely be slightly weak and short-lived. The multi-model forecast continues to favor La Niña for the next month or two, with a transition to ENSO-neutral most likely occurring between January and March (68% chance). While the type of weather expected from La Niña conditions has not occurred this winter so far, the seasonal forecast below and drought outlook above are still betting on La Niña bringing a cooler and wetter winter to the PNW, while drier and milder conditions are forecast for California and the southwest.
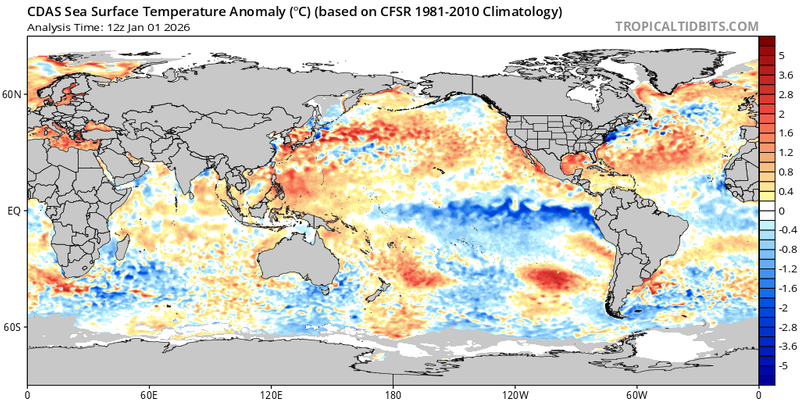
Figure 4 – Global sea surface temperatures (°C) for the period ending January 1, 2026 (image from Tropicaltibits.com).
North Pacific Watch – The pattern in North Pacific SSTs is very similar to the conditions seen at the beginning of November and December (Figure 4), continuing the negative or cool phase that the Pacific Decadal Oscillation (PDO) has been in since late 2019. The Gulf of Alaska remains slightly cooler than average, while near shore SSTs all along western North America remain warmer than average. Warm SSTs also continue over a large area in the central North Pacific, while south of Hawaii, there has been some warming across most of the basin. The current pattern in North Pacific SSTs is largely in phase with the tropical Pacific, which is cooler than average and in a La Niña (see above). The combination of a cold PDO and weak La Niña winter has commonly brought cooler temperatures and higher precipitation amounts to the PNW and northern states, while California and southern states tend to be near normal to warmer than normal and drier than normal during the winter. However, the wetter than average conditions in California and the warmer temperatures over most of the West do not follow the historic relationships between ENSO, PDO, and western US weather and climate (see the 90-day forecast below).
Forecast Periods:
Next 5 Days: A low pressure area that formed at subtropical latitudes off Baja California has brought another round of rain to southern California. Snow levels will remain high with this warmer air mass. Once this system passes through, colder air will move in, dropping snow levels and bringing widespread precipitation over most of the west. Seasonal temperatures for most.
6-10 Day (valid January 7-11): The cold air on the backside of the current system will keep most of the west below average or near average for temperatures during this period. The precipitation outlook is for mostly above average, especially in the Four Corners region, but most of the west should get some rain or snow. Except for Florida, the rest of the country is expected to see a wet period, while temperatures in the eastern two-thirds of the country are expected to rebound from the current cold Arctic air mass to above average conditions.
8-14 Day (valid January 9-15): The general pattern for temperatures continues in the west, with colder than average conditions for most during this forecast period. The ridge bringing warmer air to the east shifts eastward, leaving the middle of the country closer to average. The pattern bringing precipitation during the first ten days of the month will give way to drier than average conditions over the western states. The middle of the country is forecast to remain wetter than average during this period.
30 Day (valid January 1-31): The temperature outlook for January does not bode well for snowpacks, with warmer than average temperatures forecast for most of the western US (Figure 5). A warmer than average month is also forecast for the southern tier of states across to Florida and the southeast, while the Great Lakes and New England are likely to see below average temperatures for the month. The precipitation forecast for January is pointing to close to average amounts for the west coast, transitioning to above average in the northern Rockies south to the desert southwest. Except for southern Texas, Florida, and the southeast, which are forecast to experience a drier than average month, the rest of the country has equal chances of above to below precipitation amounts (Figure 5).
90 Day (valid January-February-March): The seasonal forecast continues to incorporate conditions expected from a La Niña, however, so far this winter, the observations have not followed these expectations, and I am not so sure they will for the second half of winter either. The current seasonal temperature outlook calls for a wetter and colder PNW across to the Great Lakes and a warmer and drier southern tier of states and into the mid-Atlantic (Figure 5). The area forecast to have the greatest probability of above average temperatures and below average precipitation during the winter includes the southwest, Texas, the southeast, and Florida. The 90-day precipitation forecast points to wetter than average conditions across the PNW, the northern Plains, Great Lakes, and Ohio River valley (Figure 5). The signal for winter precipitation is mixed for portions of California with equal chances for below to above average precipitation.
Figure 7 – Temperature (left panel) and precipitation (right panel) outlooks for the month of January (top panel) and January, February, and March (bottom panel) (Climate Prediction Center, climate.gov).